Introduction to PowerBI for librarians
10 Apr 2021This page details the notes for the VALA21 TechCamp PowerBI Workshop
All files are available on GitHub at:
Introduction
- About me
- What is PowerBI
- https://bit.ly/vala21_powerbi_pres
- What the focus is today
- 80% will be about data, data formats and data structure
- Thinking about what’s in the files, how do we connect them, and if there is no current way to join them - how to we make a way, and what are the limitations
What is PowerBI and why would I use it?
So we can go from a disparate bunch of Excel and CSV files, to a connected system/database
That can produce meaningfull reports and dashboards
Discuss difference between Excel and PowerBi and why use 1 or the other
Why are we doing this?
- Librarians know the stories of how your libraries are operating and evolving
- But if we can’t present data to support our stories and feelings we can’t have useful discussions with senior management etc. about the future of your libraries
- Give you tools and knowledge so you can have a positive impact for your libraries
Links
- This document: https://justin.kelly.org.au/vala21-techcamp-powerbi-workshop/
- Presentation: https://bit.ly/vala21_powerbi_pres
- Files
Problem:
In many cases we in libraries want to do some data analysis on our library data but for 1 of many reasons we can’t - such as:
- The LMS has a limited reporting functionality
- Only specific people allowed to use the LMS admin or reporting functionality
- LMS reporting/data is siloed - where you can analyses data separately - but not linked
- ie - can view all the bibliographic data - but not join this with the loans or the purchase info
- So can’t get a full view of whats happening in your library
- LMS admins/system people have said that to do reporting you need to do SQL and need permission from IT
- SQL is to hard and you have to know to much about that data
- IT says you can’t get permission for SQL access and should talk to the LMS admins/reporting - going round in circles not getting anywhere
In many cases we resort to using the only tool we have available (MS Excel) and trying to stitch together lots of different files together (or copy and paste large xls file contents to manual append data) into one big hot mess
Purpose:
We can overcome the obstacles that are in the way of a librarian from doing the data work required in their role.
Scenario
Can’t get access to useful library reporting systems - but the LMS admins have been nice enough to give you a bunch of seemly random data extracts covering catalogue structure, bibliographic info, loans and purchase data
We know that the data in the different files are related but when you open the files the data formats are all different and the info seems all mixed up
How do we unscramble the mess of data we’ve been given and turn it into a system that we can derive insights and analysis.
When we do the analysis we’ll do some examples using possible roles within a library such as subject librarian, branch librarian and university librarian.
The data we are going to use today is a mix of
- Real bibliographic info based on Newcastle (UK) Libraries catalogue titles
- Dewey Decimal System
- Randomised loans, prices and quantity data
- Selected Melbourne University library locations
- This data has some limitations that can’t be solved - what do we do in this case?
What we are going to do:
Turn a bunch of excel and csv files into a maintainable, share-able and accurate dashboard, that allows you to answer complex queries simply using Power BI.
The important aspects are not PowerBI and dashboards - 80% of what we will cover today is data related and can be used with other tools and environments
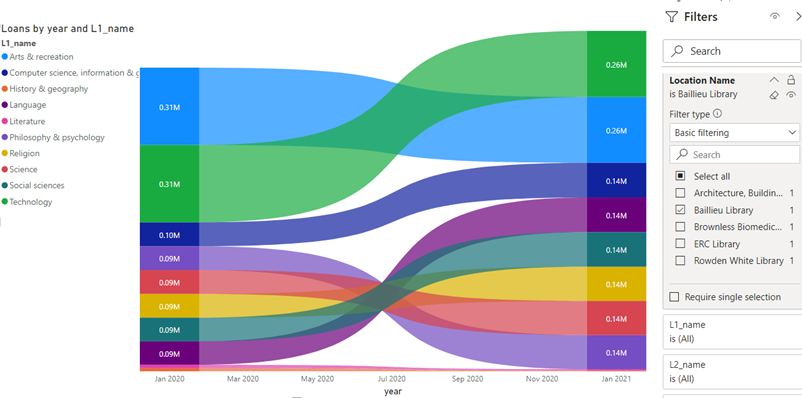
Branch librarian for the Baillieu Library want to see the change in collection use for my branch
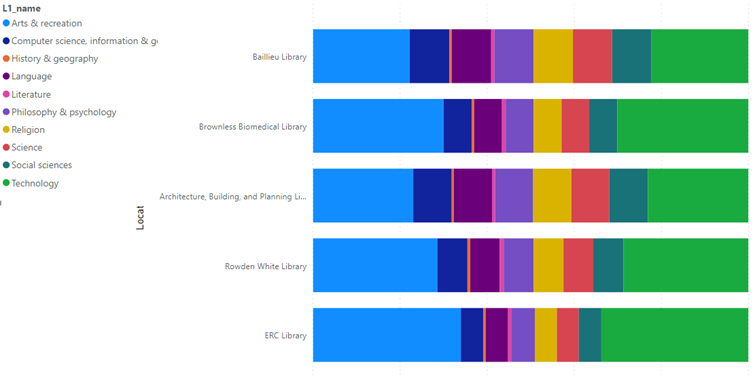
University Librarian I want to look at collection mix over all locations
Subject Librarian for Physics at Melbourne University I want to see the detailed analysis within Physics for each branch
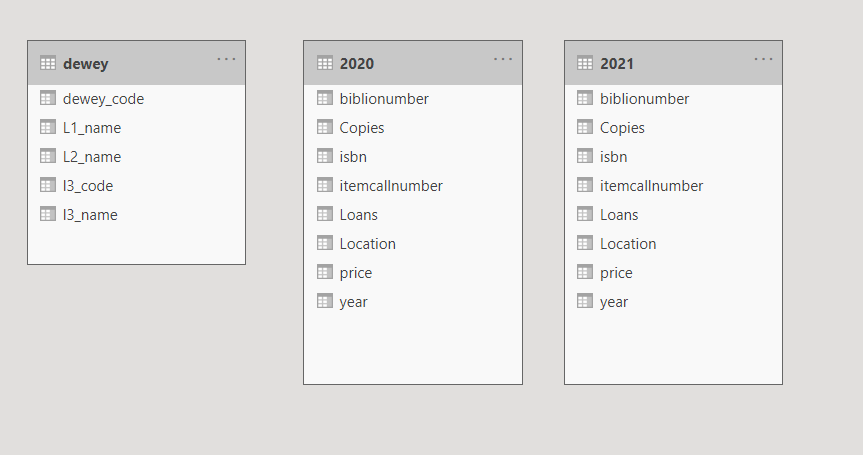
Files we have
1 file that describe the structure/hierarchy of the collection
This this example we are using the 3 level of Dewey - but you can also think of similar internal structure that your organisation may use to define collections, parent collections and sub-collection
List of branch locations
2 files that list loans, purchase cost, a holding quantity, per year for each location - 1 file per year
Section 1
What is PowerBI and intro to it’s interface
Create the library data hierarchy using the Dewey system
1 files dewey.csv
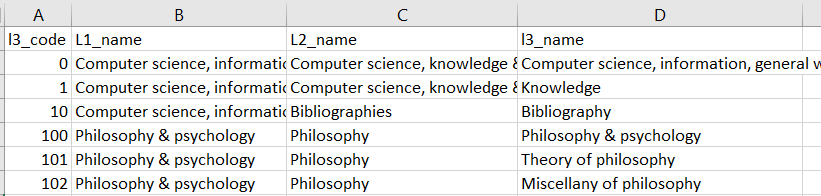
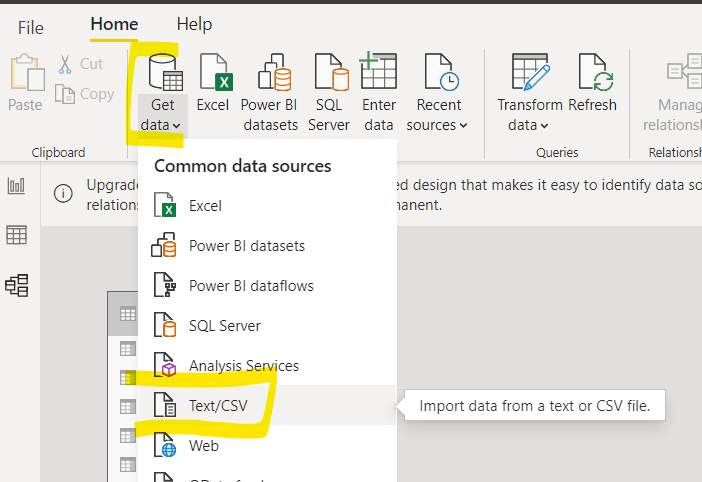
Import the data
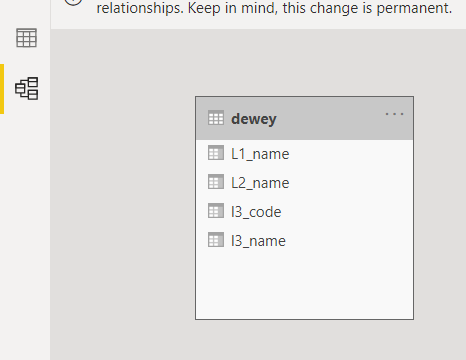
Import the Dewey file dewey.csv
Review contents and select Load
This will load into PowerBI the contents of the dewey.csv file, and will create a table in PowerBI called dewey
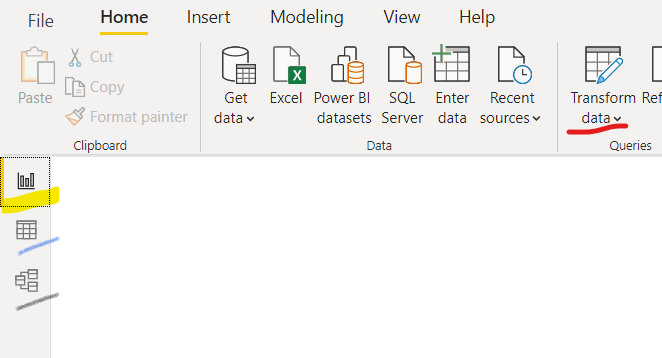
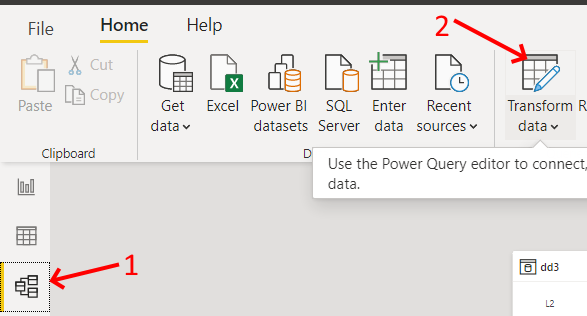
Intro to Transform Data
Within the Model view in PowerBI select the Transform Data menu from the top ribbon menu
Discuss issue with the dewey column, and how and why will be fix this. Note that the change is done once but is now automated and repeatable
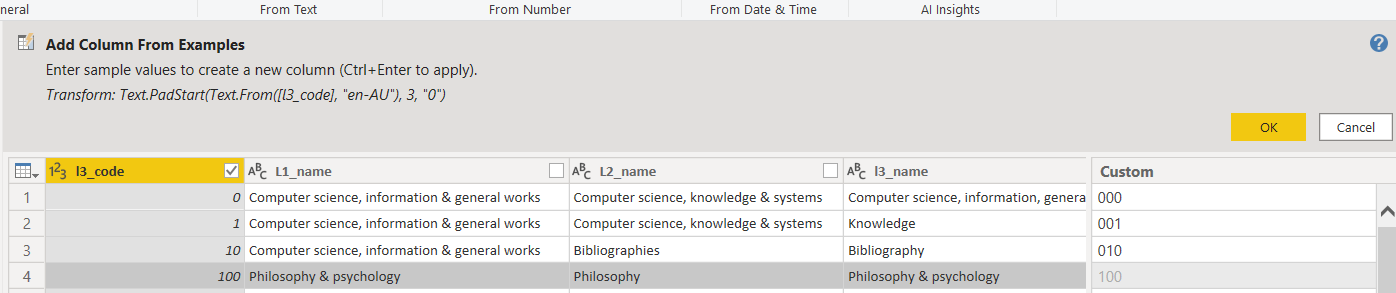
We now need to create a new column that correctly formats the dewey code to 3 characters. Name this new column dewey_code
From the Add columns menu select Column From Examples
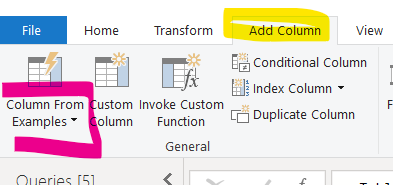
discuss what this is, and why is usefull and how is alternative to programming
Go through steps to format into 3 character dewet
Why and how?
We need a way to link the dwey file
Save the file
Then Close & Apply
Save file
Go into Report view

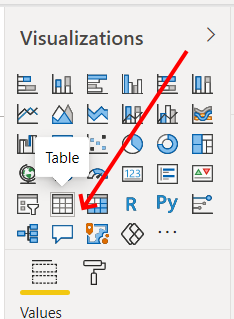
From the Visualizations section select Table
We will now drag into the Table the columns codes and names from the dewey table
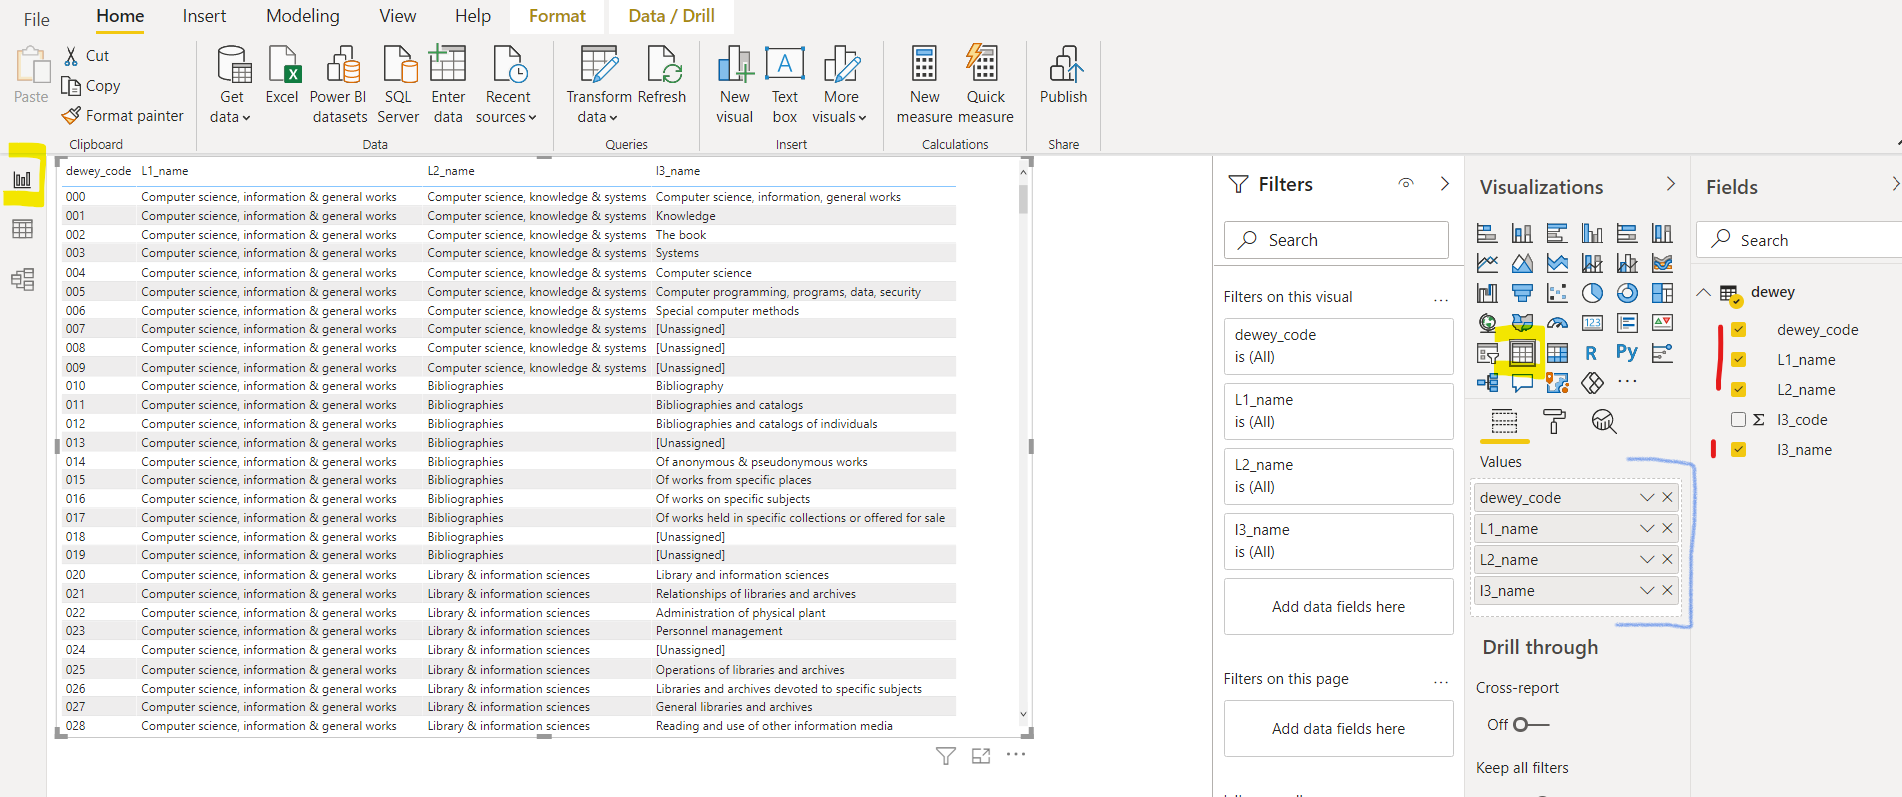
Section 1 - Create the library data hierarchy using the Dewey system is now done
Section 2
Import the loans files and link them to the dewey hierarchy
Import the 2020 loans xlsx file
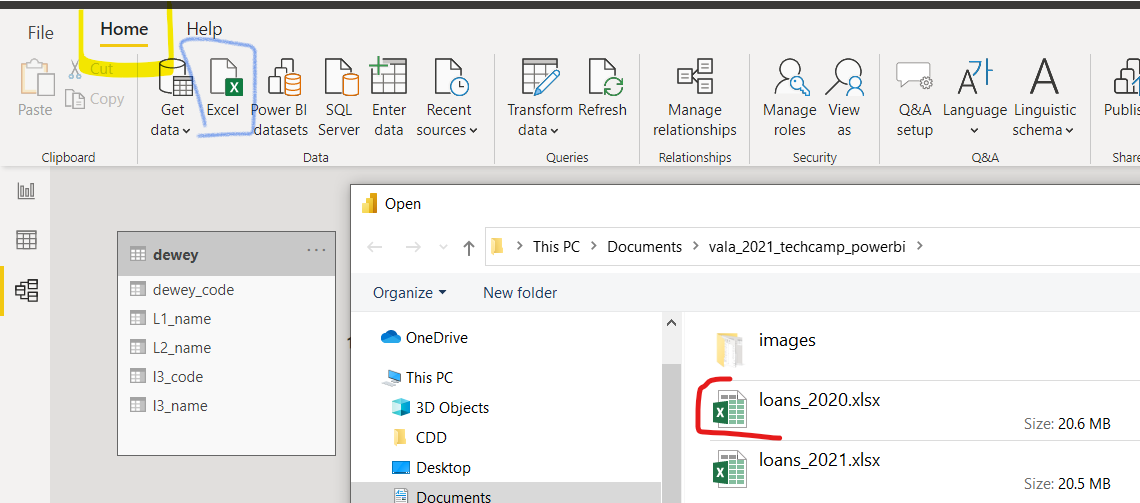
Name the new table 2020
Repeat the process and import the loans 2021 xlsx file
Name the new table 2021
Discuss what happened, file content not changed, what will happen next and why
Section 3
Merging files - one of the higlight featuers of PowerBI
Discuss why this is key and very important
Merge the 2 loans files together using Append Queries as New
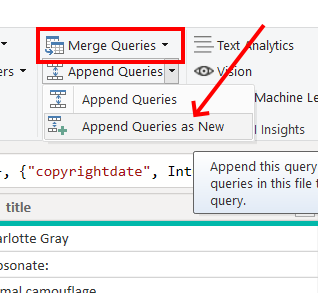
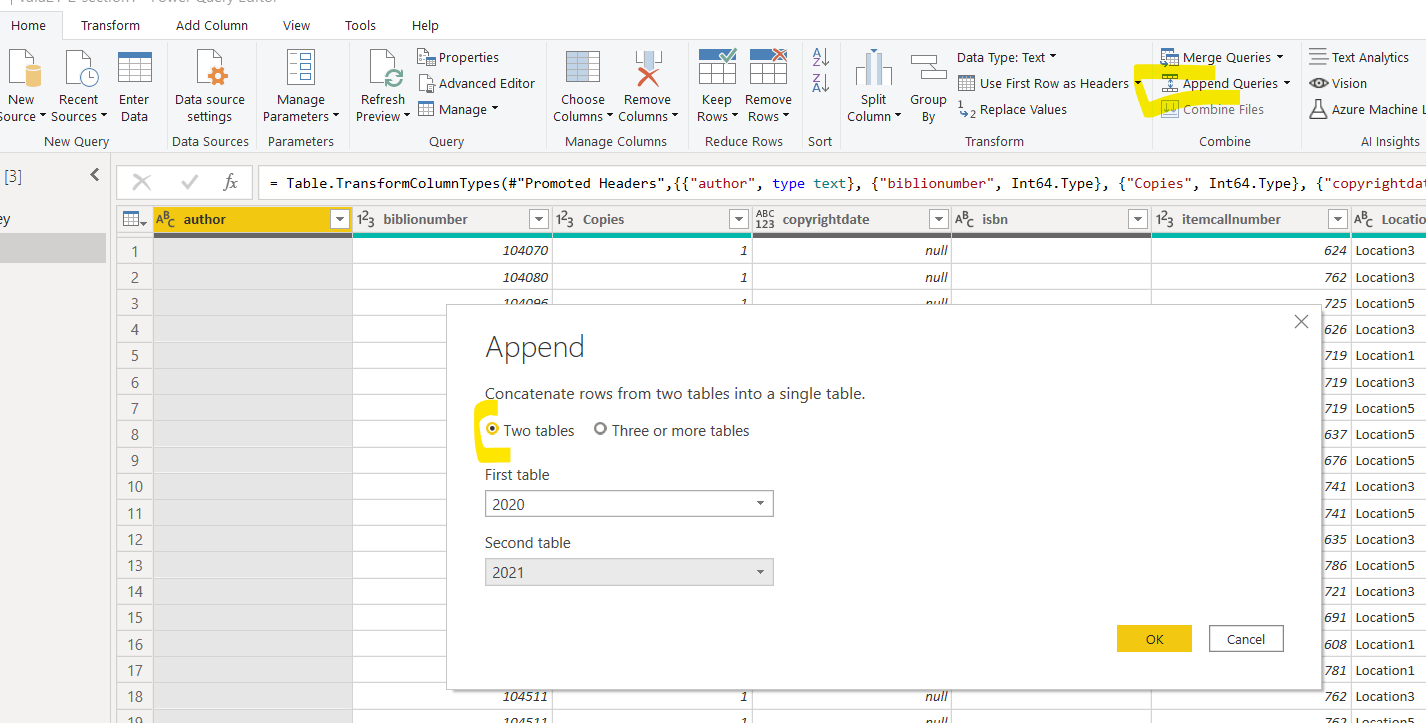
Name the new table loans and go into the Transforn Data section
Section 4
Data programming
Add a new column to format the call number to 3 digit Dewey format, using Add Column and then Columns from examples
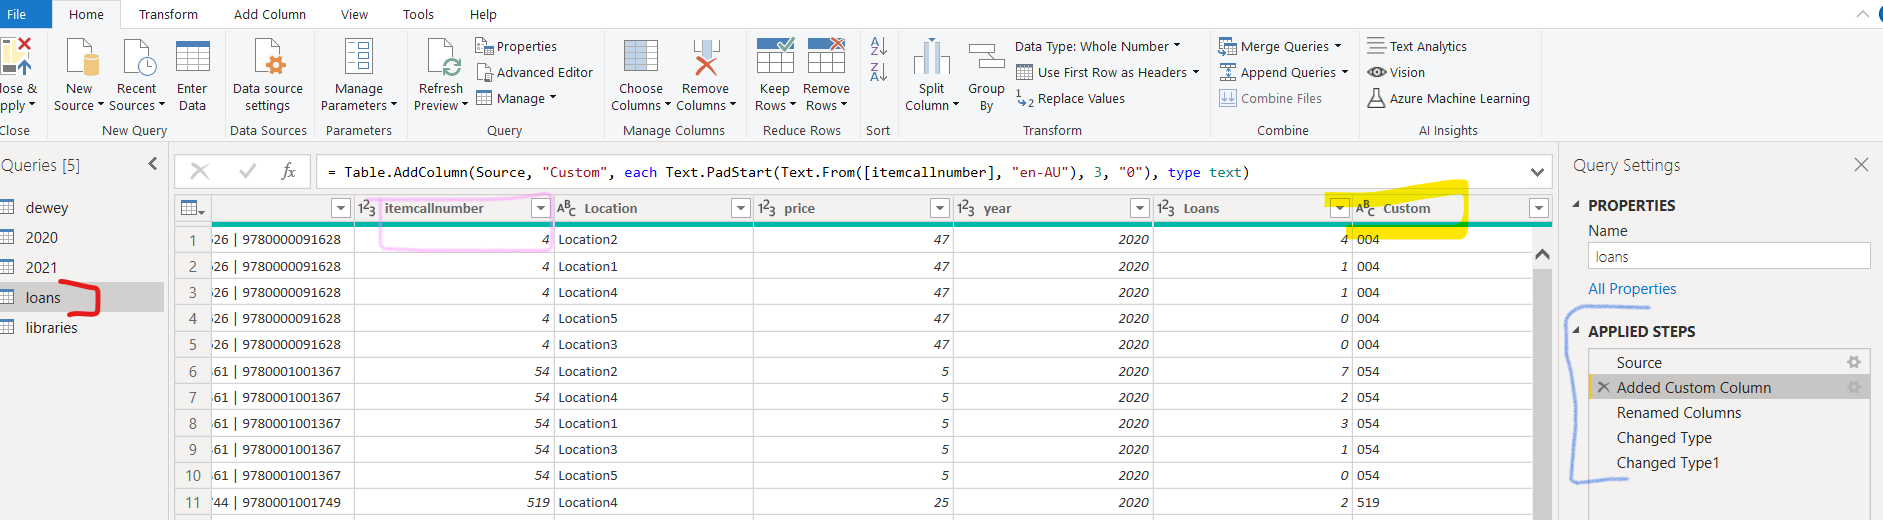
Discuss what happened and why this is important!
Rename the new columns dewey_code
Discuss why
Rename any other columns and change year to Date format
- Date needs to be changed from a Number to Text and then to Date
Right click on year and slect Date from the Change Type menu
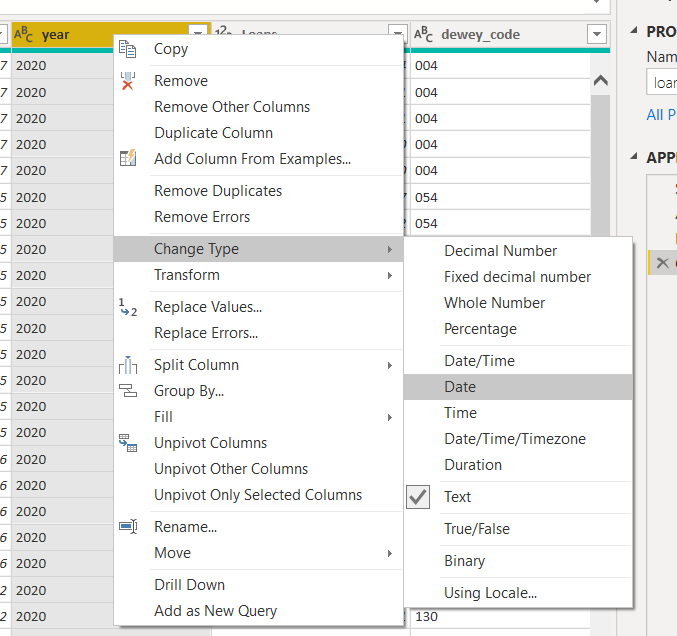
Discuss why
Save
Close and Apply
Section 5
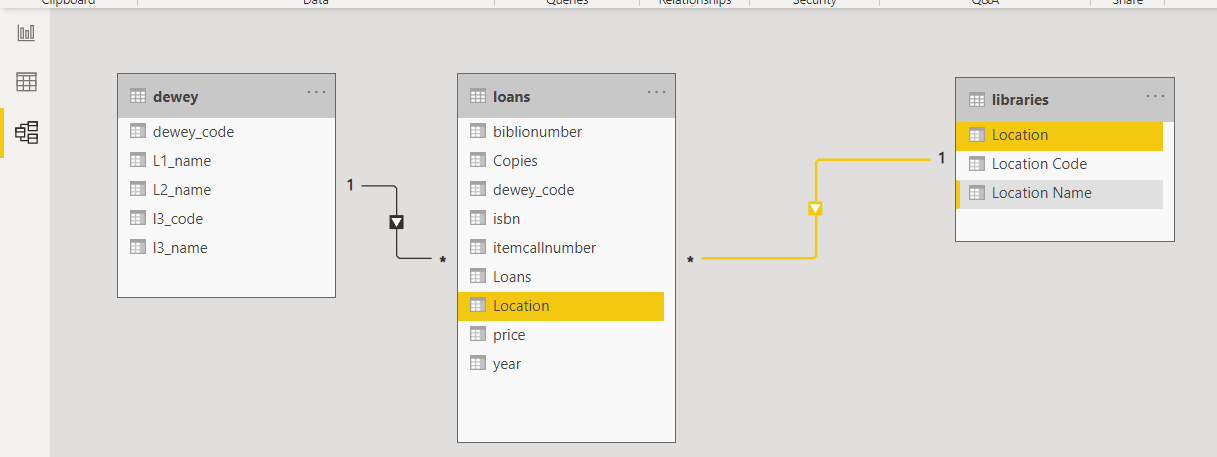
Link the files
Discuss what we are about to do and why, and how this is diffrerent from Excel
Go into the Model section

And link the loans table to the dewey table using dewey_code field in both tables. Noting that if we have namesd the fielkds correctly PowerBI may have already done this for us.
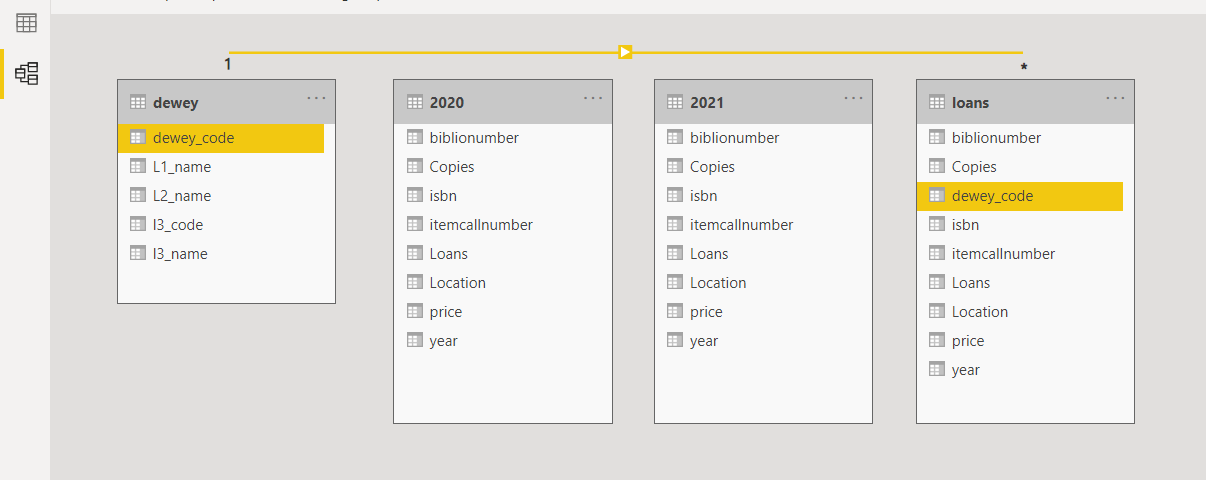
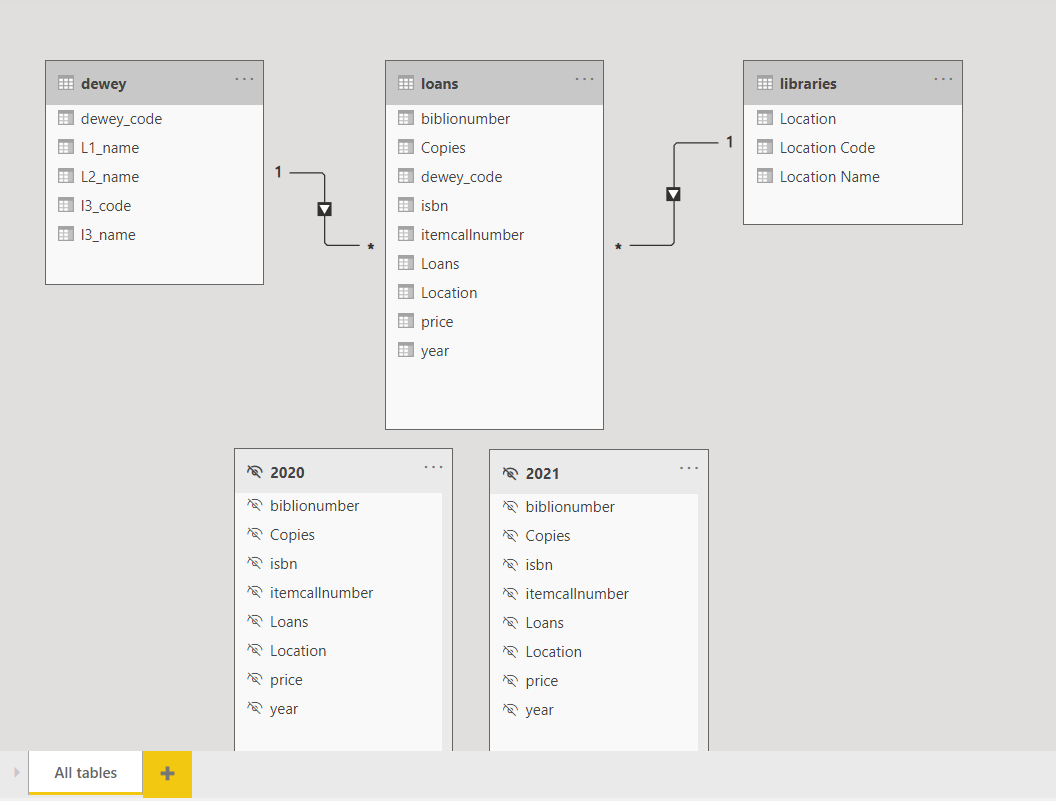
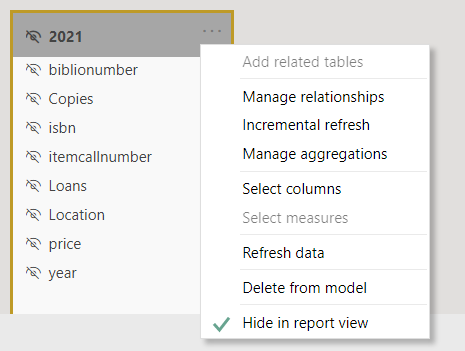
Make the 2020 and 2021 tables hidden in the reports
discuss how and why
Discuss what just happened and again why it’s important
Save
Section 6
Visualisation
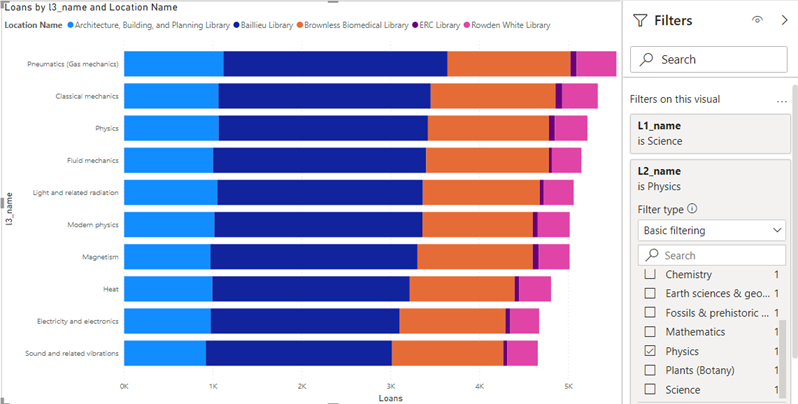
Replicate each of the 3 graphs from the intro/presentation
Go into Report view

From the Visualizations section select Table
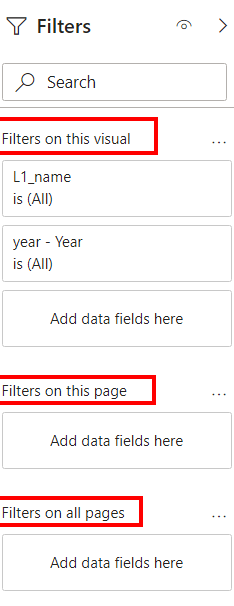
Discuss filters and level of fitlers
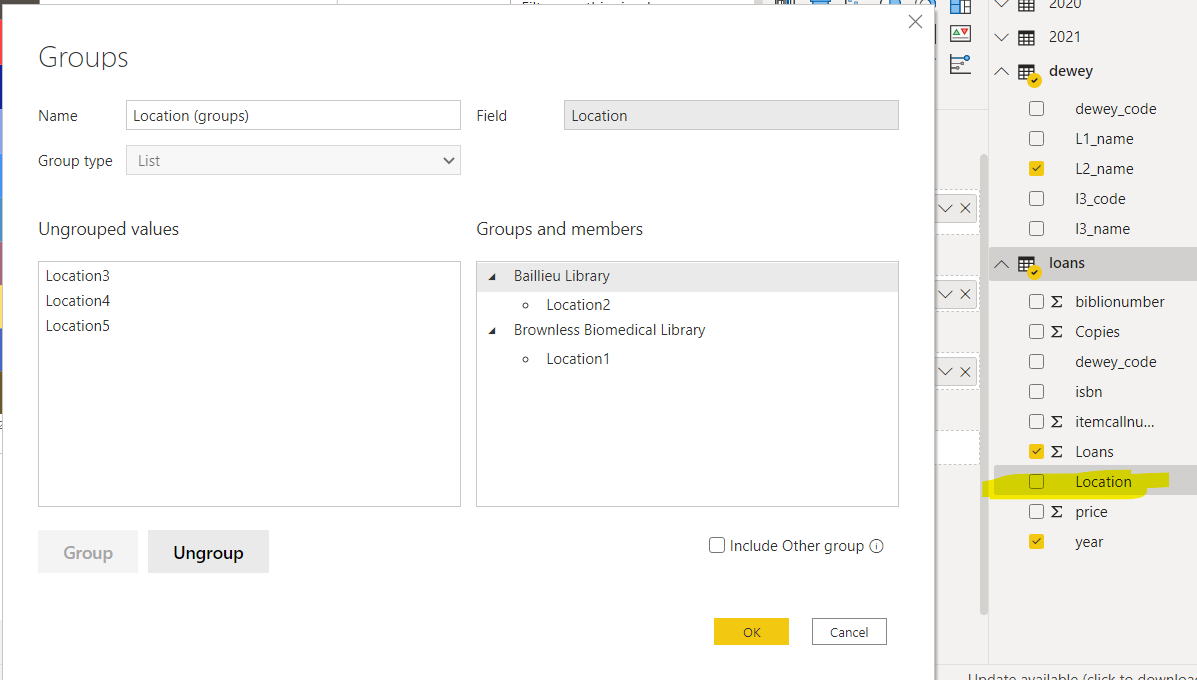
Discuss grouping, what and why and possible better solution in step 8
Right click on Location in the fields section and select New Grouping
Section 7
Calculations
This step is optional - can be ignored if taking to long or to hard
Add calculations for turnover and cost per use
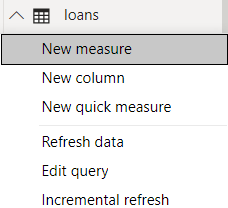
Create calculations for Total Loans, Loan Ration and Price Per Use
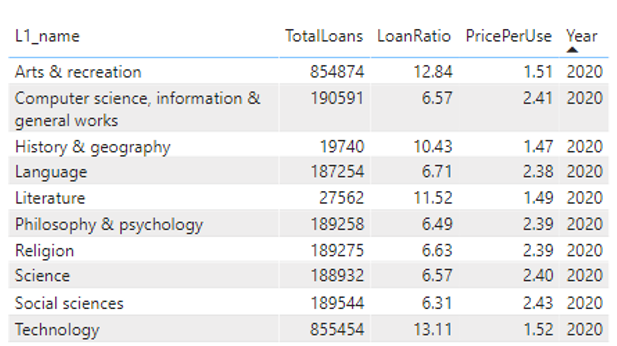
Turnover = sum(loans[Loans])/SUM(loans[Copies])
PricePerUse = sum(loans[Price])/sum(loans[Loans])
Questions
- What right about this
- What’s wrong about this
- What’s the problems
- How can we fix the problems
- Delete calculations
Do data visualistation and discuss limitation of CostPU and Turnover given underlying data issues
Section 8
Add library locations
This step is optional - can be ignored if taking to long or to hard
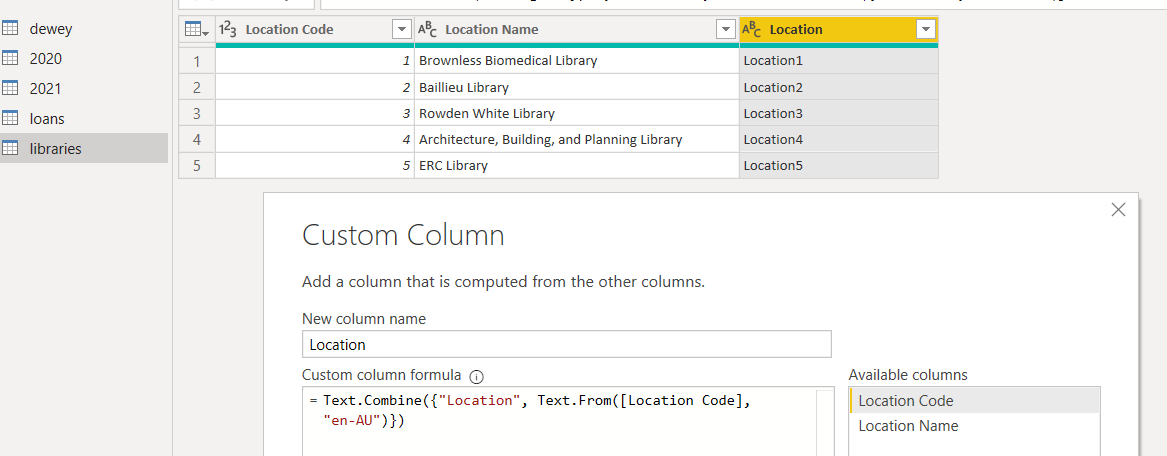
Import the libraries.csv file
Create a new column that we will use to link locations to loans
In the model view link the libraries to the loans